Quantitative Finance / Portfolio Research
CSI500 Index Enhancement Framework
CSI500 Index Enhancement
Overview
An execution-aware CSI500 index enhancement research framework combining alpha signal modelling, constrained portfolio optimization, backtesting, and execution diagnostics. The project focuses on translating model signals into tradable portfolios under practical constraints such as turnover limits, lot-size rounding, minimum trade thresholds, and capital budgets.
Annual Return
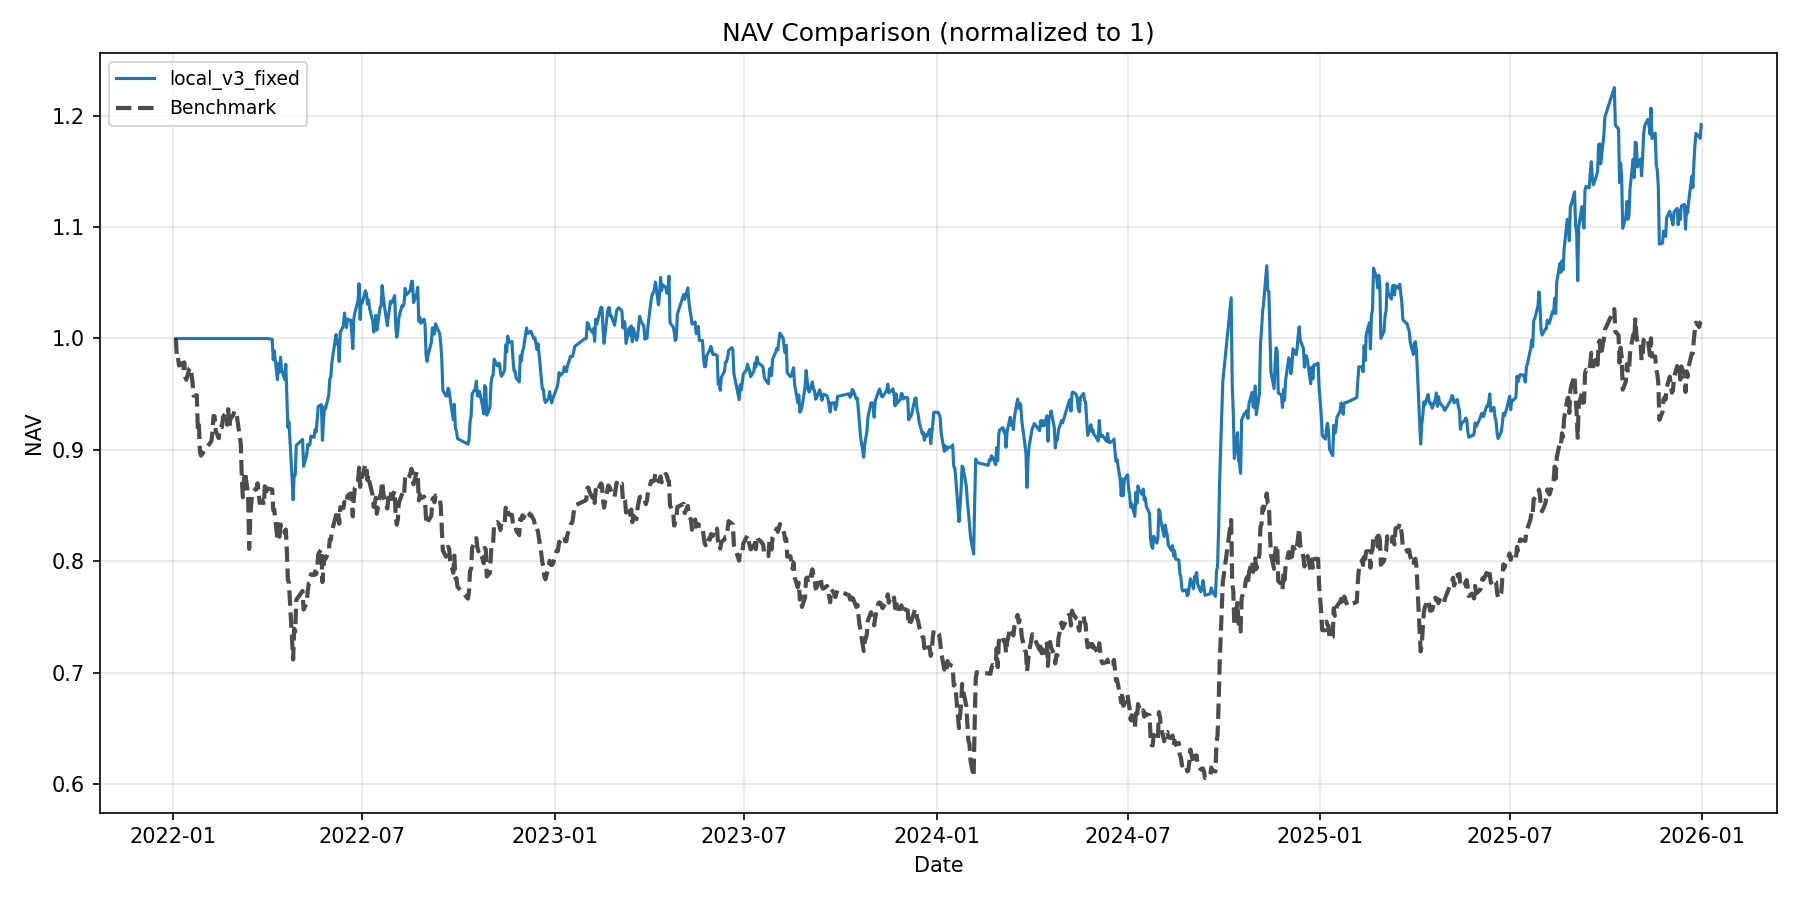
6.34%
Final metrics artifact
IR
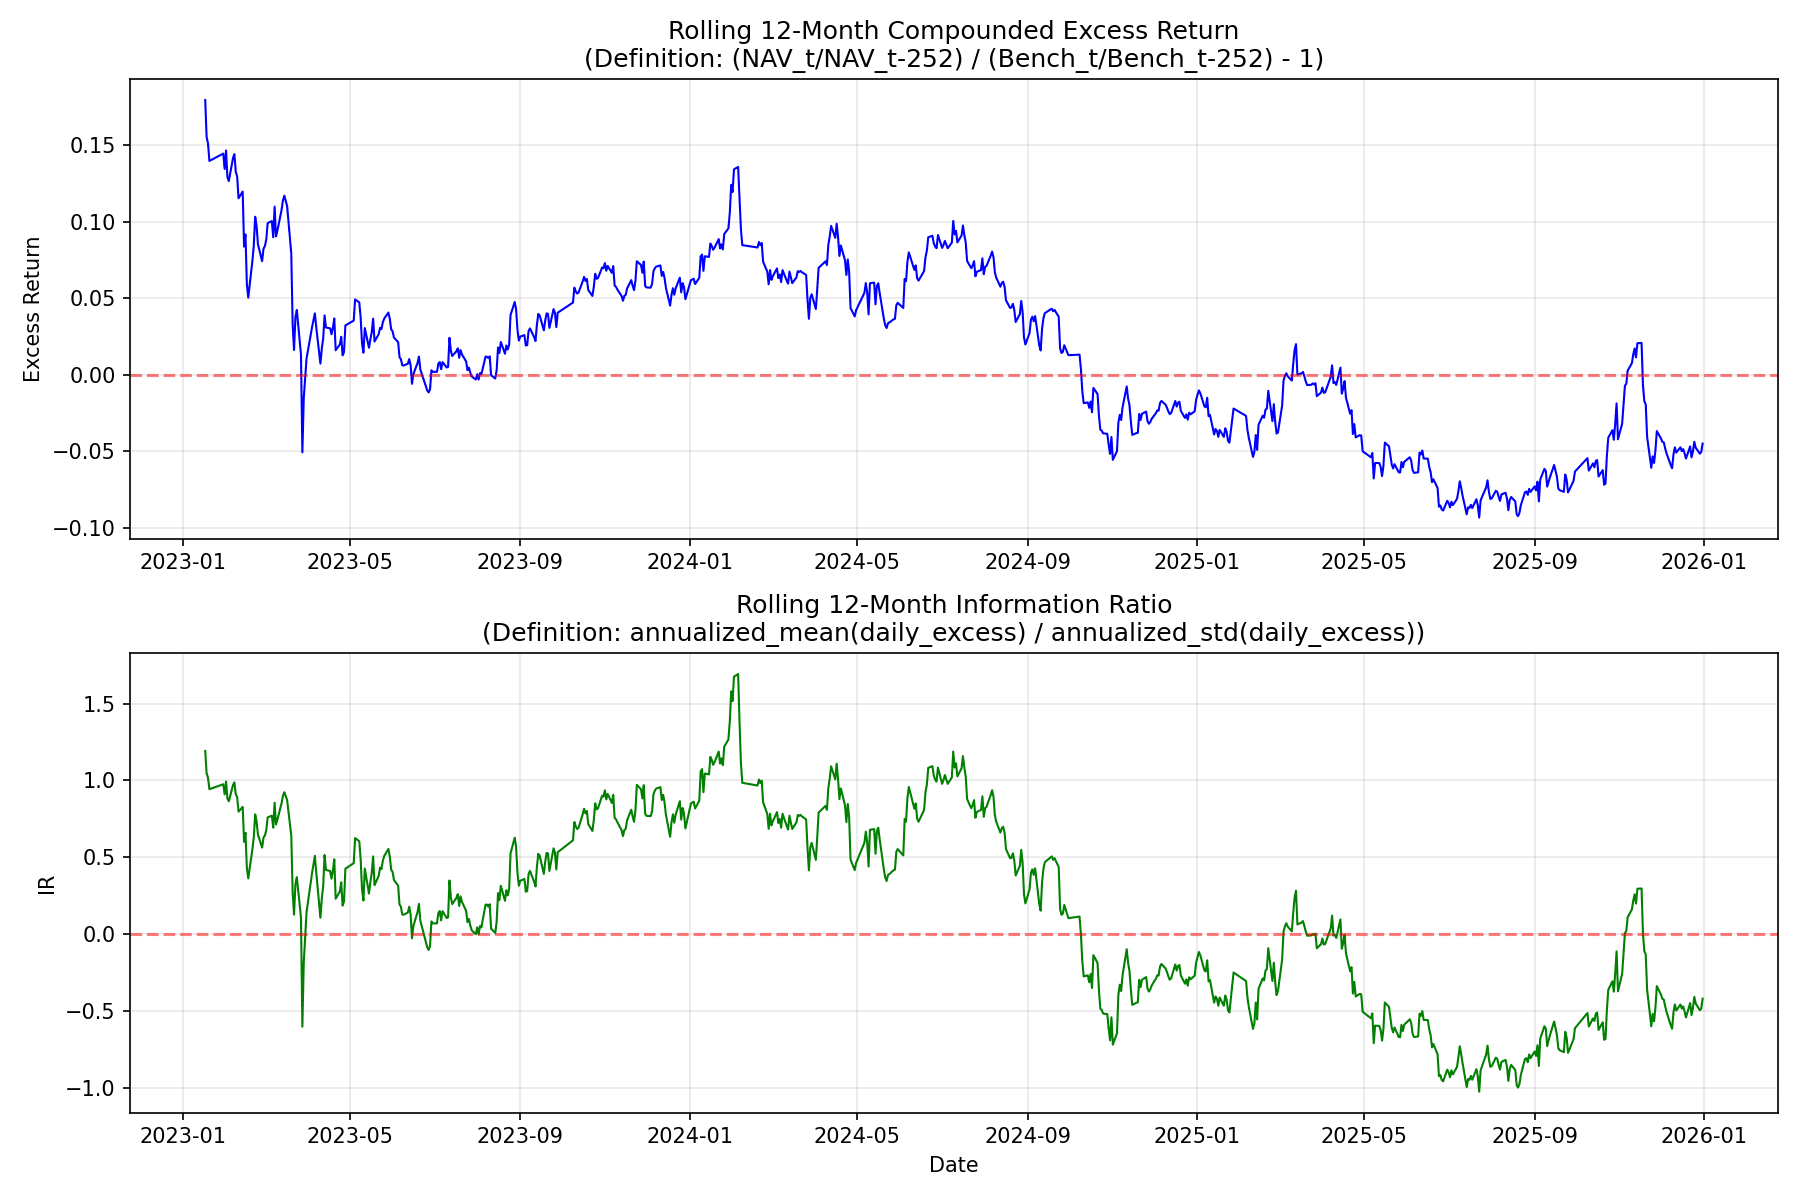
0.438
Information ratio
Tracking Error
11.28%
Max Drawdown
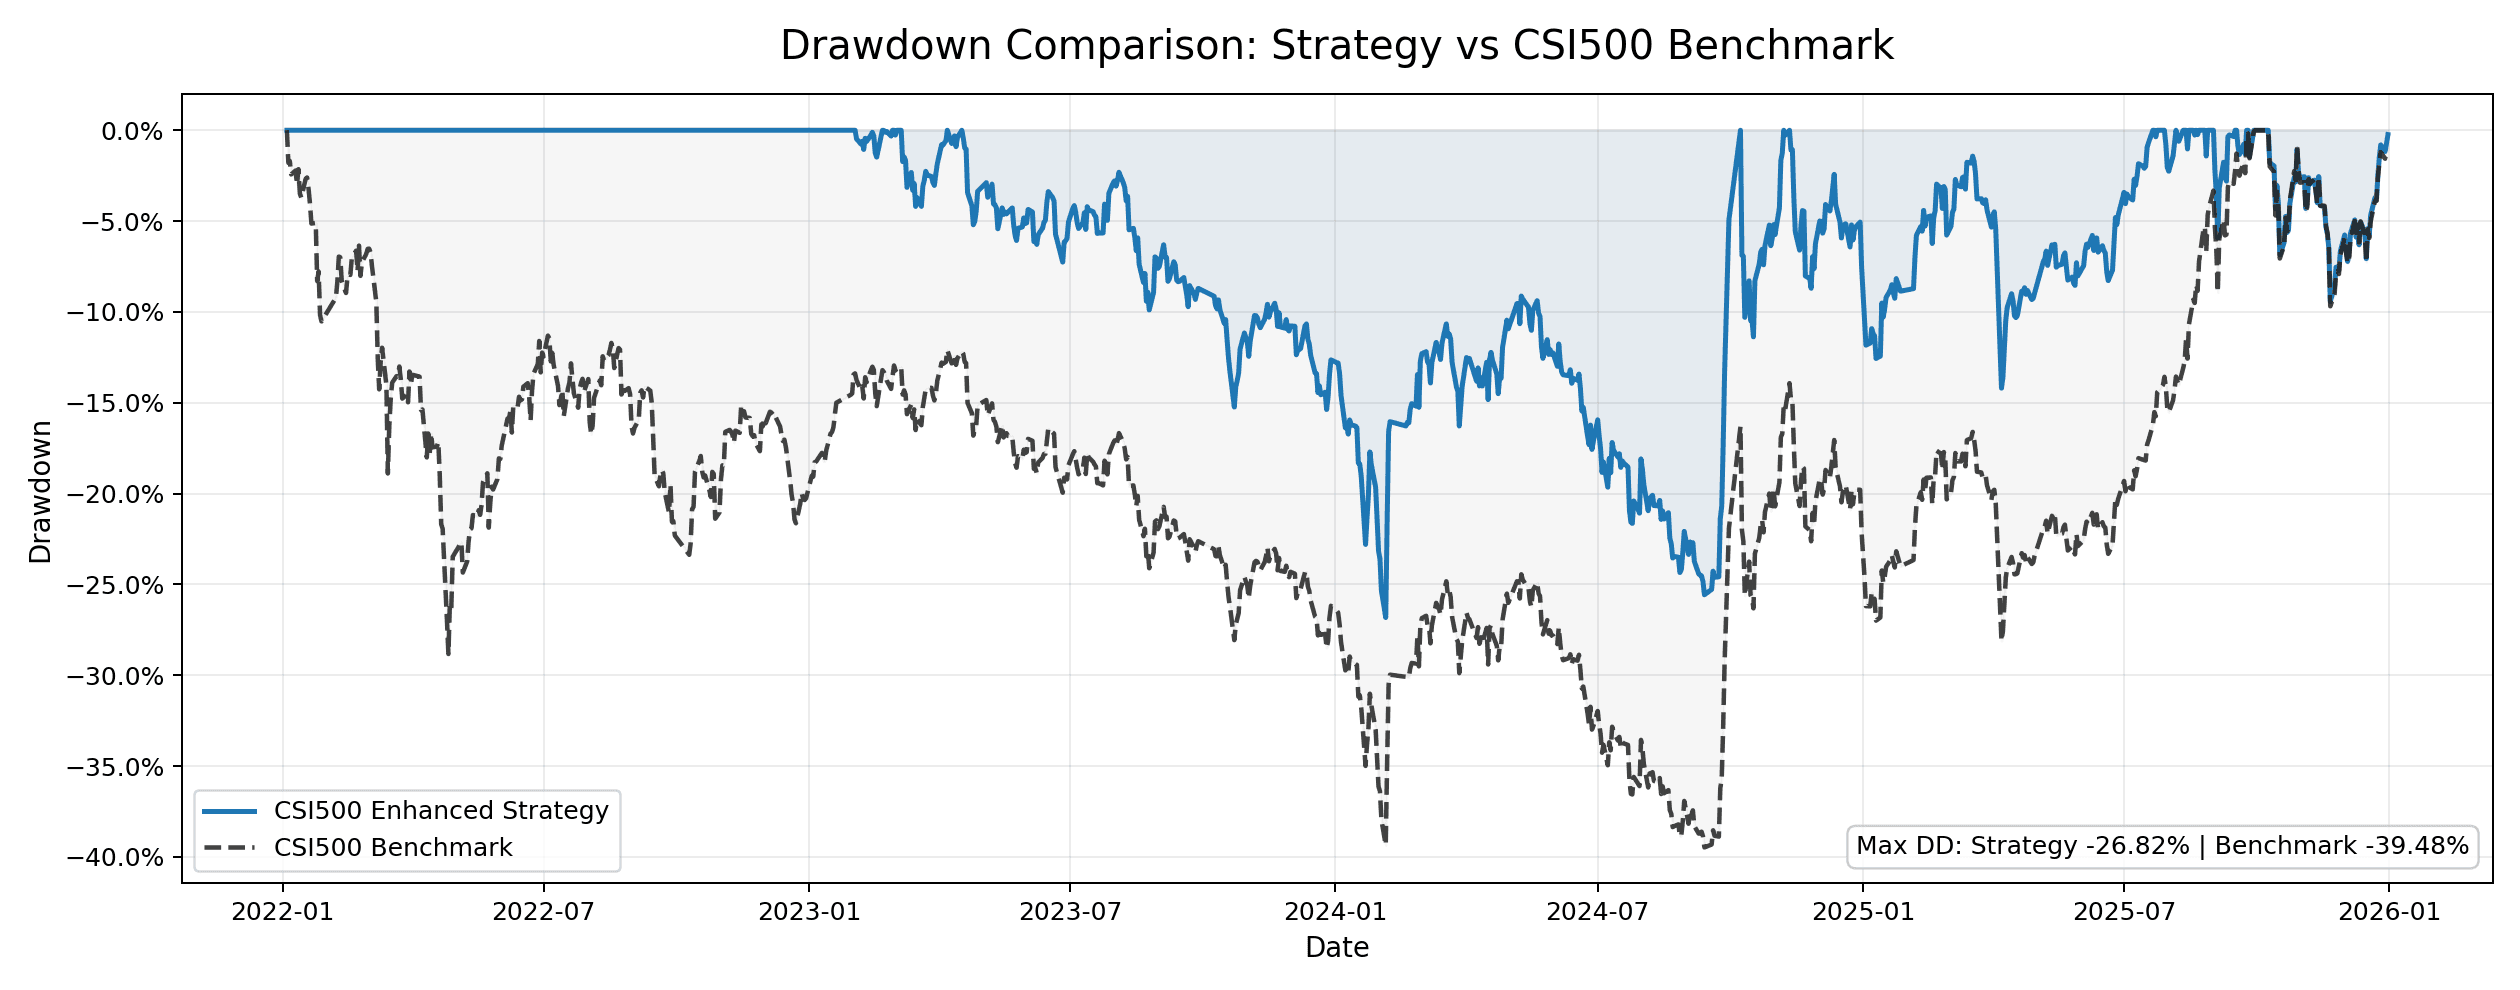
-26.82%
Avg Turnover
2.18%
OOS RankIC
0.0554
Stage 3 report
Strategy Performance
Strategy-level visuals summarize aggregate backtest behaviour and stability diagnostics. They are presented for research evaluation only.
Alpha Signal Quality
Out-of-sample signal separates future 5-day returns by decile.
The out-of-sample signal shows useful cross-sectional separation in future 5-day returns, with positive IC / RankIC and stronger average forward returns in higher-scoring deciles.
IC mean
0.0593
RankIC mean
0.0554
Decile 10 mean forward return
1.24%
Decile 1 mean forward return
≈ 0%
Systematic Experiments
The project emphasizes parameter sweeps, ablation-style comparisons, and robustness checks rather than a single headline result.
| Experiment | Setting | Representative finding | Source |
|---|---|---|---|
| Reversal weight sweep | W_REV = 0.5 | Total Return 24.95%, Ann Return 5.97%, IR 0.390, MDD -26.04% | summary_table.csv |
| Buy TopN sweep | BUY_TOPN_NOTIONAL = 10 | IR 0.475, Ann Return 6.77%, Avg Turnover 6.08% | buy_afford_v2_1_topn_sweep_table.csv |
| Active coverage / turnover cap | Coverage 0.70, Turnover cap 0.25 | IR 0.506, Ann Return 7.09%, MDD -27.15% | cov_turnover_sweep_table.csv |
| Vol-targeting sweep | Soft target vol 0.10, lookback 30 | IR 0.591, Ann Return 8.20%, MDD -26.05% | vol_dw_sweep_reco.csv |
From clean alpha to tradable portfolio
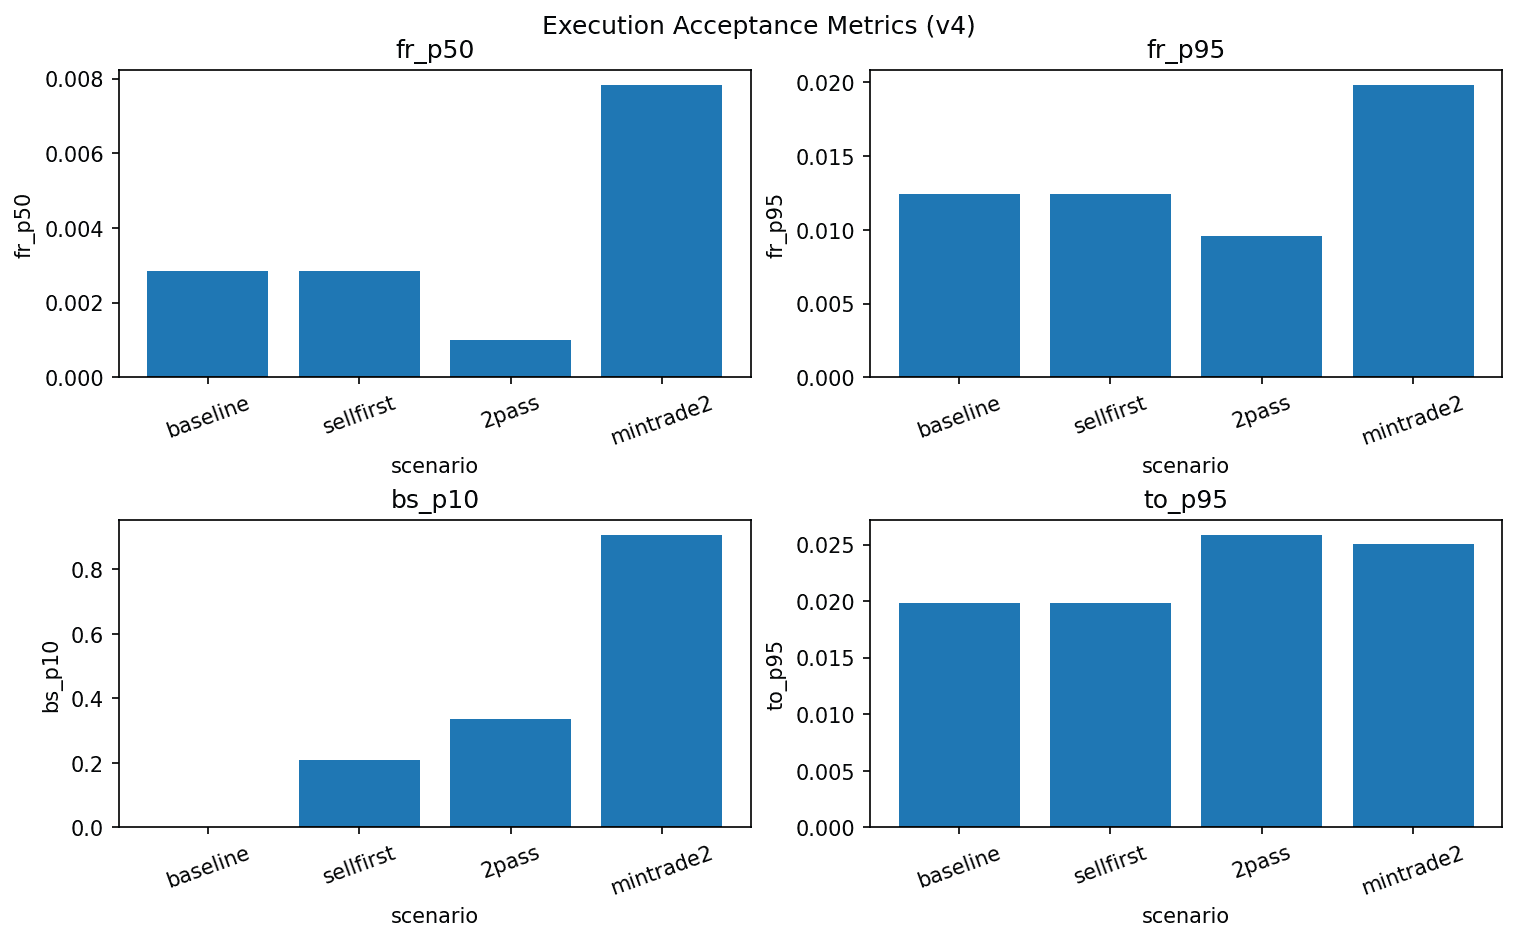
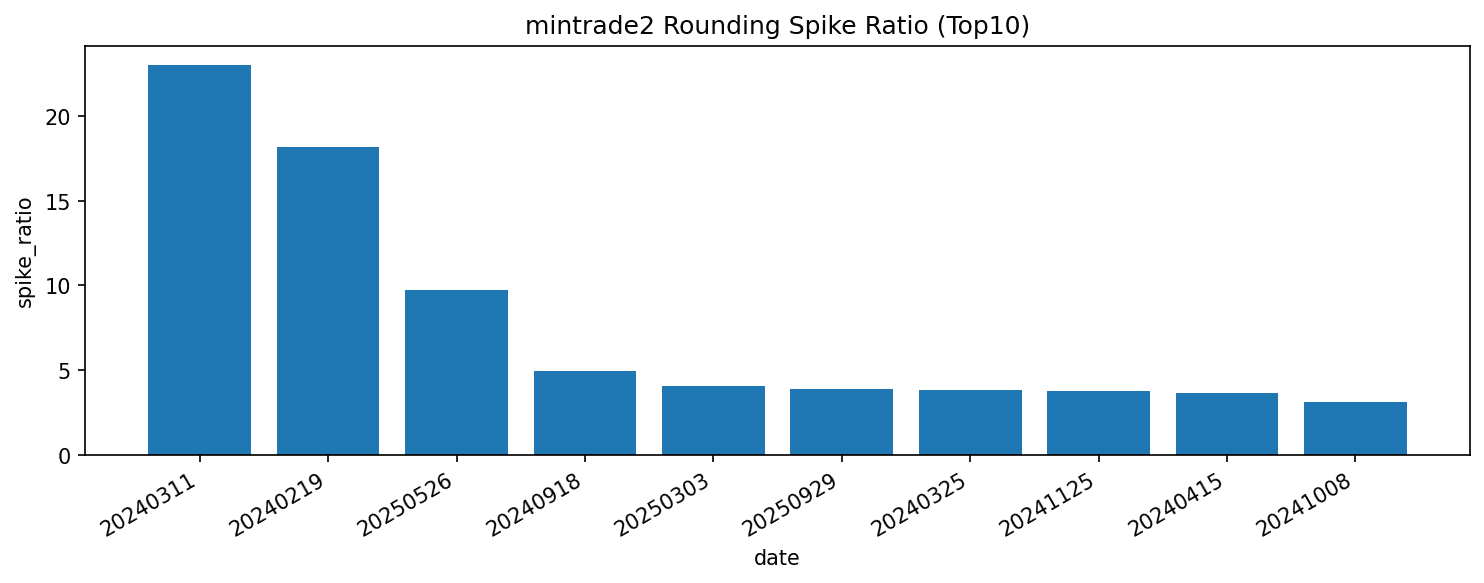
The project includes an execution-aware layer that diagnoses how practical constraints affect the translation from target trades to realized portfolios. This layer differentiates the framework from simpler signal-only backtests by quantifying practical frictions and implementation loss.
Budget cap loss
78.77%
Ratio of intended notional
Lot rounding loss
9.24%
Ratio of intended notional
Min-trade filter loss
0.00%
Diagnostic summary
Avg execution vs cap
55.10%
Zeroed buy diagnostic count
18
Research Pipeline
The workflow is designed for reproducible experimentation and public-safe reporting.
Ongoing Work
Stage 1: baseline optimizer
Stage 2: execution diagnostics + CI gate
Stage 3: OOS prediction pipeline
K6: candidate default ordering
K18: experimental guard, default OFF
My Contribution
- Built a modular research pipeline covering feature generation, forward-return labelling, alpha signal modelling, portfolio optimization, backtesting, and execution diagnostics.
- Developed an execution-aware portfolio construction layer that accounts for practical trading constraints including turnover caps, minimum trade thresholds, lot-size rounding, capital limits, and buy/sell budget usage.
- Designed diagnostic reports to compare target trades against realized execution, decomposing execution loss from budget truncation, lot rounding, and unfilled buy opportunities.
- Automated parameter sweeps, A/B experiments, and walk-forward robustness checks to evaluate sensitivity across portfolio constraints, signal configurations, and market windows.
- Evaluated strategy quality using risk-adjusted metrics including information ratio, tracking error, drawdown, turnover, OOS IC / RankIC, and execution efficiency indicators.